 Would you rather: read 300 words for 45 seconds, or digest the same information visually in just three seconds?
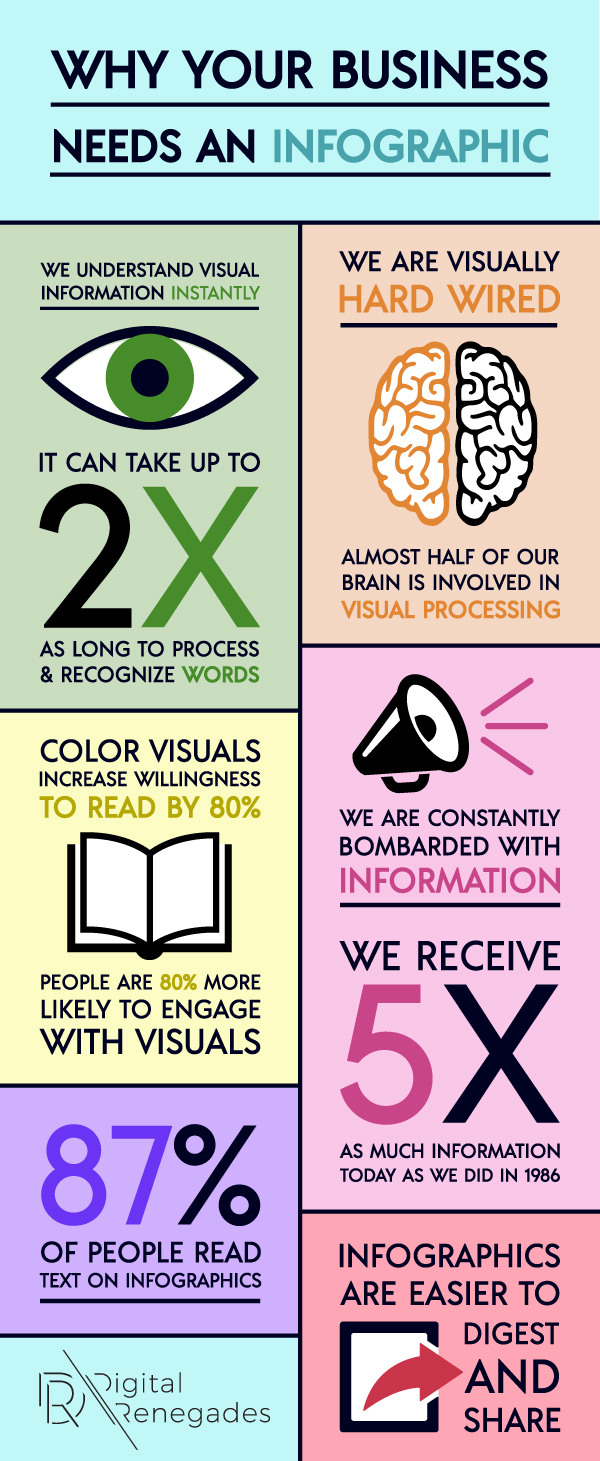
The brain processes visual information 60,000 times faster than text.
Custom infographics for businesses are a brilliant way to communicate large amounts of data without boring your customer.
You don’t need to write lots of text for an infographic. Instead, your data is represented with pictures and graphs that link together to tell the story.
The attention span of your customer is reduced. You have to compete with digital adverts, pop-ups, and other browser tabs that your reader has open.
Text doesn’t cut it anymore.
Why Visual Data Works
A website user will consume between 20 to 28% of the text on a page. People will scan a page instead of reading every word.
An infographic makes viewers consume data in a different way. The visual content engages the viewer so they pay more attention. They spend longer on your page.
Custom infographics for businesses increase customer engagement by 650% compared to text-only posts.
SEO Benefits of Custom Infographics for Businesses
Using custom visual content boosts your SEO strategy, too. More people are likely to share infographics than they are text-only posts – especially on social media.
Infographics for businesses are easily shared on all social media platforms. The visual element is easy to digest, and the word-of-mouth referral creates a strong recommendation for your brand by anyone seen to share your content.
There are also simple ways to boost your SEO strategy with an infographic – such as ensuring your image title includes essential keywords. That way, it will come up on both text and image searches in Google. Visual content will help your website to rank!
Essential Elements of Good Custom Infographics
There are a few important elements to consider when creating custom infographics for businesses:
1. Source your data
People like to know all sorts of statistics, but make sure you highlight any source to improve viewer trust.
If people can’t tell where you got your information from, it could damage your brand with a reputation for being unreliable or untrustworthy.
2. Keep it spaced
Use space as much as you can if you want the content to be easily digested by the viewer.
Don’t be afraid to create a lengthy infographic! As long as the information you’re presenting is easy to read (with plenty of space around it), people will scroll down to their heart’s content.
3. Use visual representations
Try to minimize text as much as possible.
Use graphs and images to represent the data so that it can be easily understood in mere seconds. A quick glance should be all the viewer needs to grasp the important data of your infographic.
4. Make it flow
Linking individual visuals together is important. It helps the viewer move their eye easily over the page to understand large chunks of information with ease.
An example of this would be to use your brand colors. Tie each block of your infographic together by using your main brand color as a background and your complementary color to highlight section changes.
How to Find a Custom Infographics Designer
Creating custom infographics for businesses is a niche skill. There’s an art to being able to represent huge amounts of data in a quick-to-read visual form.
It also takes several hours to condense huge amounts of text-based data into a visual representation.
Do you have the time for that?
A custom infographics designer will have the tools and skills to whip up visual content for you much faster than you could. Digital Renegades can help, if you are in need of a custom infographic. Let us know, we can source content (if needed) and build the graphic to represent your business. Try out our infographics service on your next visual content campaign and see how it improves your response rate!


Schedule a Call
Not sure if Digital Renegades is the right fit for your project? Schedule a consultation with our team and we'll help.